Technical analysis is a popular method used by traders to analyze stocks and make informed investment decisions. By studying charts and using various technical indicators, traders can identify trends and patterns in stock prices and predict future movements. If you’re new to technical analysis, this guide will provide you with the basics to get started.
What is technical analysis?
Technical analysis is a method of evaluating securities by analyzing statistics generated by market activity, such as past prices and volume.
Technical analysts believe that the historical performance of a stock can be used to predict future price movements. They use charts and various technical indicators to identify patterns and trends in stock prices, and make informed investment decisions based on this analysis.
Technical analysis is often used in conjunction with fundamental analysis, which looks at a company’s financial and economic factors to determine its value. Check nifty share price & bank nifty share price today along with all the technical information at single place.
If you’re new to technical analysis, here are some key concepts to get you started:
- Price Action: The most important aspect of technical analysis is the study of price action. Price action refers to the fluctuations in stock prices over time. By analyzing these fluctuations, traders can identify trends and patterns that may indicate future price movements.
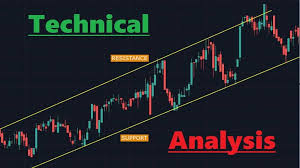
- Support and Resistance: Support and resistance levels are points on a chart where the price has historically been unable to move beyond. Support is the price level at which buying pressure is strong enough to overcome selling pressure, and resistance is the price level at which selling pressure is strong enough to overcome buying pressure. These levels can be used to identify potential entry and exit points for trades.
- Trendlines: Trendlines are lines drawn on a chart that connect two or more price points. Upward-sloping trendlines represent an uptrend, while downward-sloping trendlines represent a downtrend. Trendlines can be used to identify the direction of a trend and potential support and resistance levels.
- Technical Indicators: Technical indicators are mathematical calculations based on a stock’s price and/or volume that can be used to identify trends and potential reversals. Popular technical indicators include moving averages, relative strength index (RSI), and stochastic oscillator. Check nifty index live price & bank nifty index live price with all the technical indicators for nifty 50 & bank nifty index.
- Chart Patterns: Chart patterns are distinctive formations on a stock’s chart that can indicate potential price movements. Examples of chart patterns include head and shoulders, double tops, and triangles.
- Volume: Volume is the number of shares traded in a stock over a given period of time. High volume can indicate strong buying or selling pressure, while low volume can indicate a lack of interest in the stock.
- Time Frames: Different time frames can be used in technical analysis, from intraday charts that show price movements during a single trading day, to longer-term charts that show price movements over weeks or months.
Technical analysis is a popular method used by traders and investors to analyze stocks and predict their future price movements. The goal of technical analysis is to identify patterns in the price and volume data of a stock to help traders make informed decisions about when to buy or sell.
Here are some key concepts and tools used in technical analysis:
- Charts: Charts are used to display a stock’s price and volume data over time. There are many different types of charts, including line charts, bar charts, and candlestick charts. Traders use charts to identify patterns in the stock’s price movements, such as trends, support and resistance levels, and chart patterns.
- Indicators: Indicators are mathematical calculations that use the stock’s price and volume data to generate signals about the stock’s direction. Some common indicators used in technical analysis include moving averages, relative strength index (RSI), and stochastic oscillator.
- Trends: Trends are a key concept in technical analysis. A trend is the general direction in which the stock’s price is moving over time. Traders use trend lines to identify the trend and to determine when to enter or exit a trade.
- Support and resistance levels: Support and resistance levels are price levels where the stock has historically had difficulty breaking through. Traders use these levels to identify potential entry and exit points for trades.
- Chart patterns: Chart patterns are specific formations that appear on a stock’s chart that traders use to predict future price movements. Examples of chart patterns include head and shoulders, triangles, and double tops and bottoms.
While technical analysis can be a powerful tool for traders, it’s important to remember that it is not foolproof. Stock prices are influenced by a wide range of factors, including company earnings, economic conditions, and geopolitical events.
Traders should always use technical analysis in conjunction with other types of analysis, such as fundamental analysis, to make informed trading decisions.
Additionally, it’s important to remember that past performance is not a guarantee of future results, and traders should always use proper risk management techniques to protect their capital.
Understanding charts and indicators:
Charts and indicators are the backbone of technical analysis. Charts provide a visual representation of a stock’s price movements over time, while indicators are mathematical calculations based on the stock’s price and/or volume.
There are many different types of charts and indicators, but some of the most commonly used include candlestick charts, moving averages, and relative strength index (RSI). It’s important to understand how to read and interpret these charts and indicators in order to make informed investment decisions.
Candlestick charts, for example, provide a more detailed view of a stock’s price movements than traditional line charts. They show the opening and closing prices, as well as the high and low prices, for a given time period.
Moving averages, on the other hand, smooth out price fluctuations over time and can help identify trends. The RSI is a momentum indicator that measures the strength of a stock’s price action.
By understanding how to read and interpret these charts and indicators, investors can gain valuable insights into a stock’s performance and make informed decisions about when to buy or sell. However, it’s important to remember that technical analysis is just one tool in the investor’s toolbox and should be used in conjunction with other forms of analysis, such as fundamental analysis and market research.
Identifying trends and patterns:
One of the key aspects of technical analysis is identifying trends and patterns in a stock’s price movements. A trend is the general direction in which a stock’s price is moving, either up (bullish) or down (bearish).
Patterns, on the other hand, are specific formations that occur within a trend and can provide insight into future price movements. Some common patterns include head and shoulders, double tops and bottoms, and triangles.
By identifying these trends and patterns, investors can make more informed decisions about when to buy or sell a stock.
To identify trends, technical analysts often use moving averages, which smooth out price fluctuations and provide a clearer picture of the stock’s overall direction. They may also use trendlines, which connect the highs or lows of a stock’s price movements over a certain period of time.
Patterns, on the other hand, can be identified through chart analysis. For example, a head and shoulders pattern consists of three peaks, with the middle peak being the highest. This pattern is often seen as a bearish signal, indicating that the stock’s price may be about to decline.
By using these tools to identify trends and patterns, technical analysts can gain a better understanding of a stock’s price movements and make more informed investment decisions.
Using support and resistance levels:
Another important aspect of technical analysis is identifying support and resistance levels. Support levels are price points at which a stock has historically had difficulty falling below, while resistance levels are price points at which a stock has historically had difficulty rising above.
By identifying these levels, investors can make more informed decisions about when to buy or sell a stock. For example, if a stock is approaching a resistance level, it may be a good time to sell, while if it is approaching a support level, it may be a good time to buy.
To identify support and resistance levels, investors can use a variety of tools, including trend lines, moving averages, and chart patterns.
Trend lines are drawn by connecting the lows or highs of a stock’s price over a certain period of time. Moving averages are calculated by averaging a stock’s price over a certain period of time, and can help smooth out short-term fluctuations in price.
Chart patterns, such as head and shoulders or double tops, can also indicate potential support or resistance levels. By using these tools, investors can better understand a stock’s price movements and make more informed trading decisions.
Developing a trading strategy:
Once you have a good understanding of technical analysis and have identified potential stocks to invest in, it’s important to develop a trading strategy.
This strategy should outline your goals, risk tolerance, and the specific criteria you will use to make investment decisions. For example, you may decide to only invest in stocks that have a certain level of trading volume or have shown consistent growth over a certain period of time.
It’s important to stick to your strategy and not let emotions or short-term market fluctuations influence your decisions.
When developing your trading strategy, it’s also important to consider your exit strategy. This means determining when you will sell your stocks, whether it’s based on a certain price target or a specific timeframe.
It’s important to have a plan in place to avoid holding onto stocks for too long and potentially losing money.
Additionally, it’s important to regularly review and adjust your strategy as needed based on market conditions and your own personal goals and risk tolerance.
By developing a solid trading strategy, you can increase your chances of success in the stock market.
Tools for technical analysis:
There are several tools and indicators that traders use for technical analysis. Here are some of the commonly used ones:
- Moving averages: Moving averages are used to identify the trend of the stock. The most commonly used moving averages are 50-day and 200-day moving averages.
- Relative Strength Index (RSI): RSI is used to determine whether a stock is overbought or oversold. It oscillates between 0 and 100 and a reading above 70 is considered overbought while a reading below 30 is considered oversold.
- Bollinger Bands: Bollinger Bands are used to measure the volatility of a stock. The bands are drawn two standard deviations away from a moving average.
- Fibonacci retracements: Fibonacci retracements are used to identify support and resistance levels in a stock. The retracement levels are based on the Fibonacci sequence of numbers.
- MACD (Moving Average Convergence Divergence): MACD is used to identify changes in the momentum of a stock. It is calculated by subtracting the 26-day exponential moving average from the 12-day exponential moving average.
- Candlestick charts: Candlestick charts are used to identify trends and patterns in a stock. They provide information on the open, high, low and close prices for a given period.
- Volume: Volume is used to confirm the strength of a trend. High volume indicates that there is strong conviction behind a move in the stock price.
These are just a few of the tools and indicators used in technical analysis. Traders often use a combination of these tools to make informed trading decisions.
Best technical indicators:
There are many technical indicators used by traders and analysts to make buy and sell decisions. The best technical indicators depend on the individual’s trading style, risk tolerance, and market conditions.
Here are some of the popular technical indicators:
- Moving Averages: Moving averages are trend-following indicators that smooth out price data by creating a constantly updated average. They help traders identify the direction of the trend and potential support and resistance levels.
- Relative Strength Index (RSI): RSI is a momentum oscillator that measures the speed and change of price movements. It compares the magnitude of recent gains to recent losses to determine overbought or oversold conditions.
- Bollinger Bands: Bollinger Bands are volatility indicators that measure the highness or lowness of the price relative to previous trades. They consist of a moving average and two standard deviations plotted above and below the moving average.
- Fibonacci Retracement: Fibonacci retracement is a technical analysis tool used to identify potential support and resistance levels based on the Fibonacci sequence. It is based on the idea that prices will retrace a predictable portion of a move, after which they will continue to move in the original direction.
- MACD (Moving Average Convergence Divergence): MACD is a trend-following momentum indicator that shows the relationship between two moving averages of prices. It is used to spot changes in the strength, direction, momentum, and duration of a trend in a stock’s price.
- Stochastic Oscillator: The Stochastic Oscillator is a momentum indicator that measures the location of the current price relative to the high-low range over a set number of periods. It is used to determine overbought and oversold conditions.
- Volume: Volume is an important indicator used to confirm trends, price movement, and potential reversals. High volume levels may indicate the strength of the trend or signal a potential reversal.
These are some of the most widely used technical indicators, but it is important to remember that no single indicator can provide a foolproof trading strategy. Traders often use multiple indicators in combination to increase the probability of a successful trade.
How to Use Technical Analysis to Make Informed Stock Trading Decisions:
Technical analysis is a popular method used by traders and investors to make informed stock trading decisions. It involves analyzing historical price and volume data of a particular stock to identify patterns and trends that can help predict future price movements. Here are some steps on how to use technical analysis to make informed stock trading decisions:
- Identify the stock you want to analyze: Choose the stock that you want to analyze based on your investment goals, risk tolerance, and personal preferences.
- Choose your timeframe: Technical analysis can be done using various timeframes, including intraday, daily, weekly, and monthly charts. Choose a timeframe that suits your trading style and goals.
- Analyze the charts: Use various technical indicators and tools to analyze the stock’s historical price and volume data. This can include trendlines, moving averages, oscillators, and other indicators.
- Identify patterns and trends: Look for patterns and trends in the charts that can help you predict future price movements. This can include support and resistance levels, chart patterns like triangles and head and shoulders, and trendlines.
- Determine your entry and exit points: Based on your analysis, identify potential entry and exit points for your trades. This can include buying or selling at key support or resistance levels, using moving average crossovers, or using other indicators to signal buy or sell signals.
- Set stop-loss and take-profit orders: To manage risk and ensure profitability, set stop-loss and take-profit orders to automatically close your trades at predetermined levels.
- Monitor your trades: Once you have entered a trade, monitor it closely to ensure that it is performing as expected. Adjust your stop-loss and take-profit levels as needed based on changing market conditions.
By following these steps, you can use technical analysis to make informed stock trading decisions that can help you achieve your investment goals. However, it is important to remember that technical analysis is just one tool in a trader’s arsenal and should be used in conjunction with other forms of analysis and risk management strategies.
It is important to note that technical analysis indicators should be used in combination with other forms of analysis, such as fundamental analysis, to make informed trading decisions. Learn the technique to trade Nifty 50 share and bank nifty share.
Related Posts:
How to Analyze FII DII Data for Stock Market Investments?
A Beginner’s Guide to Investing in the Stock Market