There are various websites and platforms that provide NSE heatmaps, which visually display the performance of the different stocks traded on the NSE. Also learn the tricks of using Nifty heatmap. Here are some options:
- NSE India’s official website (https://www.nseindia.com/): NSE provides live market data and also displays a heatmap of the top gainers and losers on its homepage.
- MoneyControl (https://www.moneycontrol.com/): MoneyControl is a popular financial news and information website in India. They provide a heatmap of the top gainers and losers on the NSE, as well as a sector-wise heatmap.
- Investing.com (https://in.investing.com/): Investing.com is a global financial portal that provides real-time data and news for markets around the world. They have a heatmap that displays the top gainers and losers on the NSE, as well as other market indices.
These are just a few examples, but there are many other websites and platforms that provide NSE heatmaps. You can try searching online for “NSE heatmap” to find more options.
How to use Nifty heatmap?
The NSE heatmap can be a useful tool to track the performance of the stocks traded on the National Stock Exchange (NSE) of India. Here are some steps on how to use the nifty heatmap:
- Choose a heatmap provider: As I mentioned earlier, there are various websites and platforms that provide NSE heatmaps. Choose one that you prefer and find easy to use.
- Understand the layout: The heatmap typically displays a color-coded table that shows the stocks traded on the NSE. The table is usually divided into different sectors or indices. The colors indicate the performance of each stock, with green indicating gains and red indicating losses.
- Check the legend: Each heatmap should have a legend that explains the color-coding used. Make sure you understand what each color means before interpreting the data.
- Look for patterns: Use the heatmap to identify trends or patterns in the performance of the different stocks. Look for sectors or indices that are consistently showing gains or losses.
- Use filters: Some heatmap providers allow you to filter the data based on specific criteria, such as market capitalization or trading volume. This can help you focus on stocks that meet your investment goals.
- Keep up to date: The NSE heatmap is a real-time tool that updates continuously throughout the trading day. Check the heatmap regularly to stay informed about the performance of the NSE.
Remember that the NSE heatmap is just one tool for analyzing the performance of the stock market. It should be used in conjunction with other sources of information, such as company financials, news, and expert analysis, to make informed investment decisions.
Type of heatmap:
Heatmaps are a type of data visualization that uses color coding to represent the values of a matrix or table. There are various types of heatmaps, including:
- Classic Heatmap: This is the most common type of heatmap that displays a matrix of values using a color gradient. The higher the value, the darker the color.
- Correlation Heatmap: This type of heatmap is used to visualize the correlation between different variables. The heatmap displays a matrix of correlation coefficients, with color coding indicating the strength and direction of the correlation.
- Geographic Heatmap: A geographic heatmap uses color coding to represent the density or frequency of data points on a map. This type of heatmap is often used to visualize location-based data, such as population density or crime rates.
- Time-series Heatmap: This type of heatmap is used to visualize changes in data over time. The heatmap displays a matrix of values for different time intervals, with color coding indicating the magnitude of change.
- Hierarchical Heatmap: A hierarchical heatmap displays a matrix of values in a tree-like structure, with rows and columns grouped based on similarity. This type of heatmap is often used in genetics or biology to visualize gene expression data.
- Value by Time Heatmap: This type of heatmap displays how a value changes over time. It is often used in finance to visualize stock prices or market trends.
These are just a few examples of the different types of heatmaps. Heatmaps are versatile and can be customized to suit a wide range of data visualization needs.
Best nse heatmap for indian stock market:
There are several heatmap providers for the National Stock Exchange (NSE) of India, and the best one for you may depend on your specific needs and preferences. Here are some of the top NSE heatmap providers:
- MoneyControl (https://www.moneycontrol.com/): MoneyControl is a popular financial news and information website in India. They provide a heatmap of the top gainers and losers on the NSE, as well as a sector-wise heatmap. They also offer a wide range of other financial tools and resources.
- NSE India’s official website (https://www.nseindia.com/): NSE provides live market data and also displays a heatmap of the top gainers and losers on its homepage. As the official website of the NSE, it is a reliable source of information and data.
- Investing.com (https://in.investing.com/): Investing.com is a global financial portal that provides real-time data and news for markets around the world. They have a heatmap that displays the top gainers and losers on the NSE, as well as other market indices.
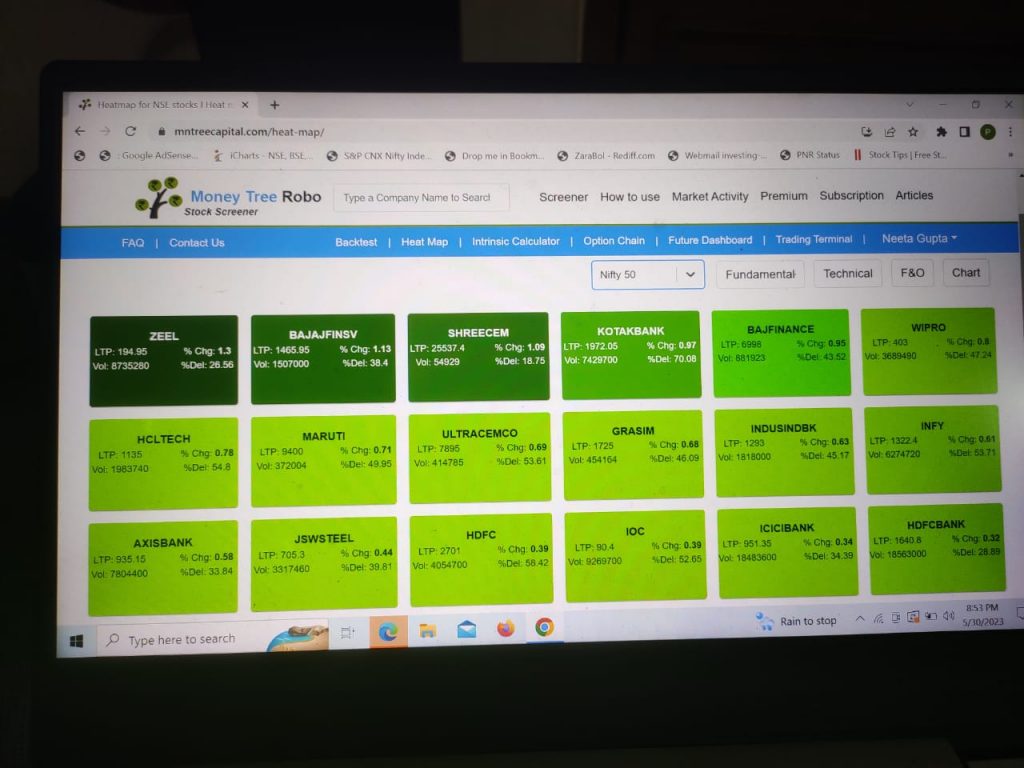
- Money Tree Robo website (https://www.mntreecapital.com/): Money Tree robo is a comprehensive stock market research and analysis platform that offers a range of tools, including a heatmap of the NSE. They also provide a range of other research and analysis tools, including technical and fundamental analysis. Get the heatmap for NSE stocks with live share price of stocks, percentage change, volume analysis, % delivery volume, buy sell signal & stock entry price levels. Get fundamental analysis of any stock on heatmap. Get technical analysis of any Nifty 50 heatmap for NSE stocks, Bank Nifty stocks, F&O stocks heatmap. Analyze the future & option data like open interest analysis, no of trades, stocks future price, open interest etc for F&O stocks. Get technical analysis & fundamental analysis sector wise & many more data.
These are just a few examples, but there are many other NSE heatmap providers available. I recommend trying a few and seeing which one works best for your needs.
Related Posts:
What is stock screener? How to use a Stock Screener to Find Winning Stocks?
What Are Penny Stocks and Why Are They So Popular?
How to Trade on the basis of Moving Averages of stocks?
How to trade 52week high stocks & 52week low stocks?
How to trade high dividend paying stocks?
How to Invest in Nifty 50 Share Price: Tips and Strategies?H
ow to Invest in BankNifty Share Price: Tips and Strategies?
What is CANSLIM Method? How to choose stocks on this method?